URL: Dashboard
The FigsFlow Dashboard provides a snapshot of your business performance, helping you track and analyse essential metrics. The dashboard is divided into four sections, each offering a unique perspective on your firm’s performance over the selected time period.
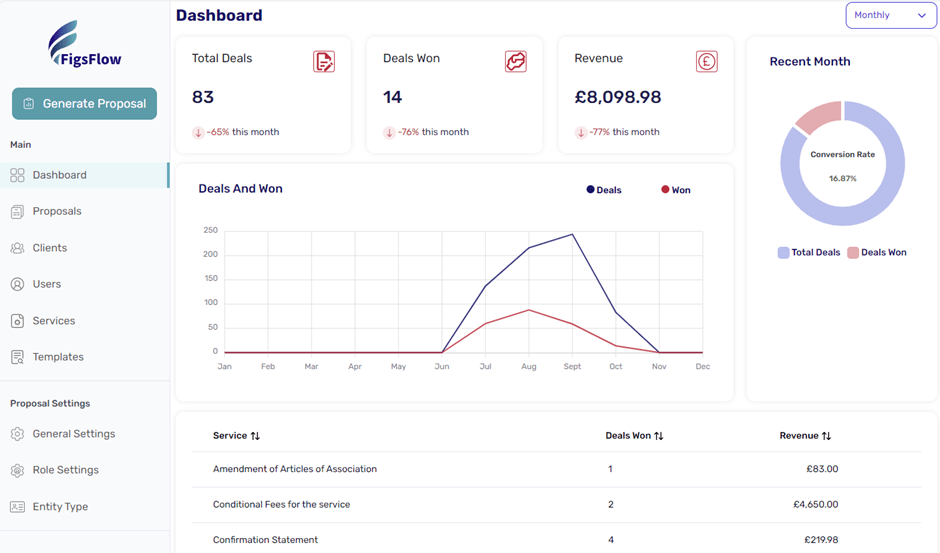
Section 1: Total Entity, Won Entity, and Revenue
- Total Entity: Displays the total number of entities in either the Live or Won state during the selected time period. Entities in the Live state are awaiting signatures, while those in the Won state have successfully signed an engagement letter.
- Won Entity: Shows the total number of entities that have signed the engagement letter within the selected time period and are ready to start business with you.
- Revenue: Represents the annualised revenue generated from won entities. If the service provided is a One-off type, the revenue is not annualised and is added directly to the total revenue for the period.
Example: If the selected period is Monthly, with 22 total entities (15 won entities) and £38,718.78 in revenue, it means that 22 entities are in the Live or Won state during the month, 15 entities have been won, and the annualised revenue from the won entity is £38,718.78. - The time periods available for selection are Monthly, Quarterly, and Annually, allowing you to tailor the dashboard view to your preferred reporting period.
Section 2: Conversion Rate
This section offers a graphical representation of your business’s conversion rate for the selected time period. It visually displays the proportion of won entities compared to those in the Live or Won state. This chart helps you easily assess your business’s success in converting potential clients into actual clients.
Section 3: Monthly Entity Tracking (Line Graph)
A line graph displays the Total Entity vs Won Entity for each month over the year. This chart helps you visualise how your firm has performed on a month-by-month basis, allowing for trend analysis and insights into your entity conversion progress.
Section 4: Service Table
The service table provides detailed insights into your business’s services. It includes:
- Total Service Count: The number of times a particular service has been included in the Total Entities.
- Won Service Count: The number of times the service has been included in Won Entities.
- Annualised Revenue: The revenue generated from the service across won entities.
This section is particularly useful for identifying which services are driving the most revenue and seeing how frequently each service is used in your proposals.
With these four sections, the FigsFlow Dashboard provides a comprehensive and detailed view of your firm’s overall performance and helps identify key growth areas.