
Home › Platform › Practice dashboard
Practice dashboard · CanadaSee the whole firm on one screen
FigsFlow is practice dashboard software for Canadian accounting firms. Work in progress, CRA deadlines, team capacity and unbilled time sit in one live view, so partners spot the T1 or T2 backlog in February rather than in April.
 G2 reviews
 Verified reviews
Illustrative dashboard. Figures are sample data.
Happy on FigsFlow





Why partners still build the weekly report by hand
Deadlines sit in one spreadsheet, hours in the time system and capacity in someone’s head. By the time it is pulled together on Monday, the week has already moved on.
The numbers live in five tools
- WIP in the time system, deadlines in a spreadsheet
- Capacity guessed from who looks busiest
- A late T2 discovered when the client calls
- The partner meeting spent rebuilding last week
One live view of the practice
- Deadlines, work and billing from the same records
- Capacity per person against booked hours
- Risk flagged well before the statutory date
- The partner meeting starts from the dashboard
What partners look at every Monday
Work, deadlines, people and money. Each view draws on the same records, so the numbers always agree.
Every job, by stage and owner
Jobs grouped by service, from T1 and T2 to T3, GST/HST, payroll and bookkeeping, each with its stage, owner and due date. Filter by partner, office or client segment.
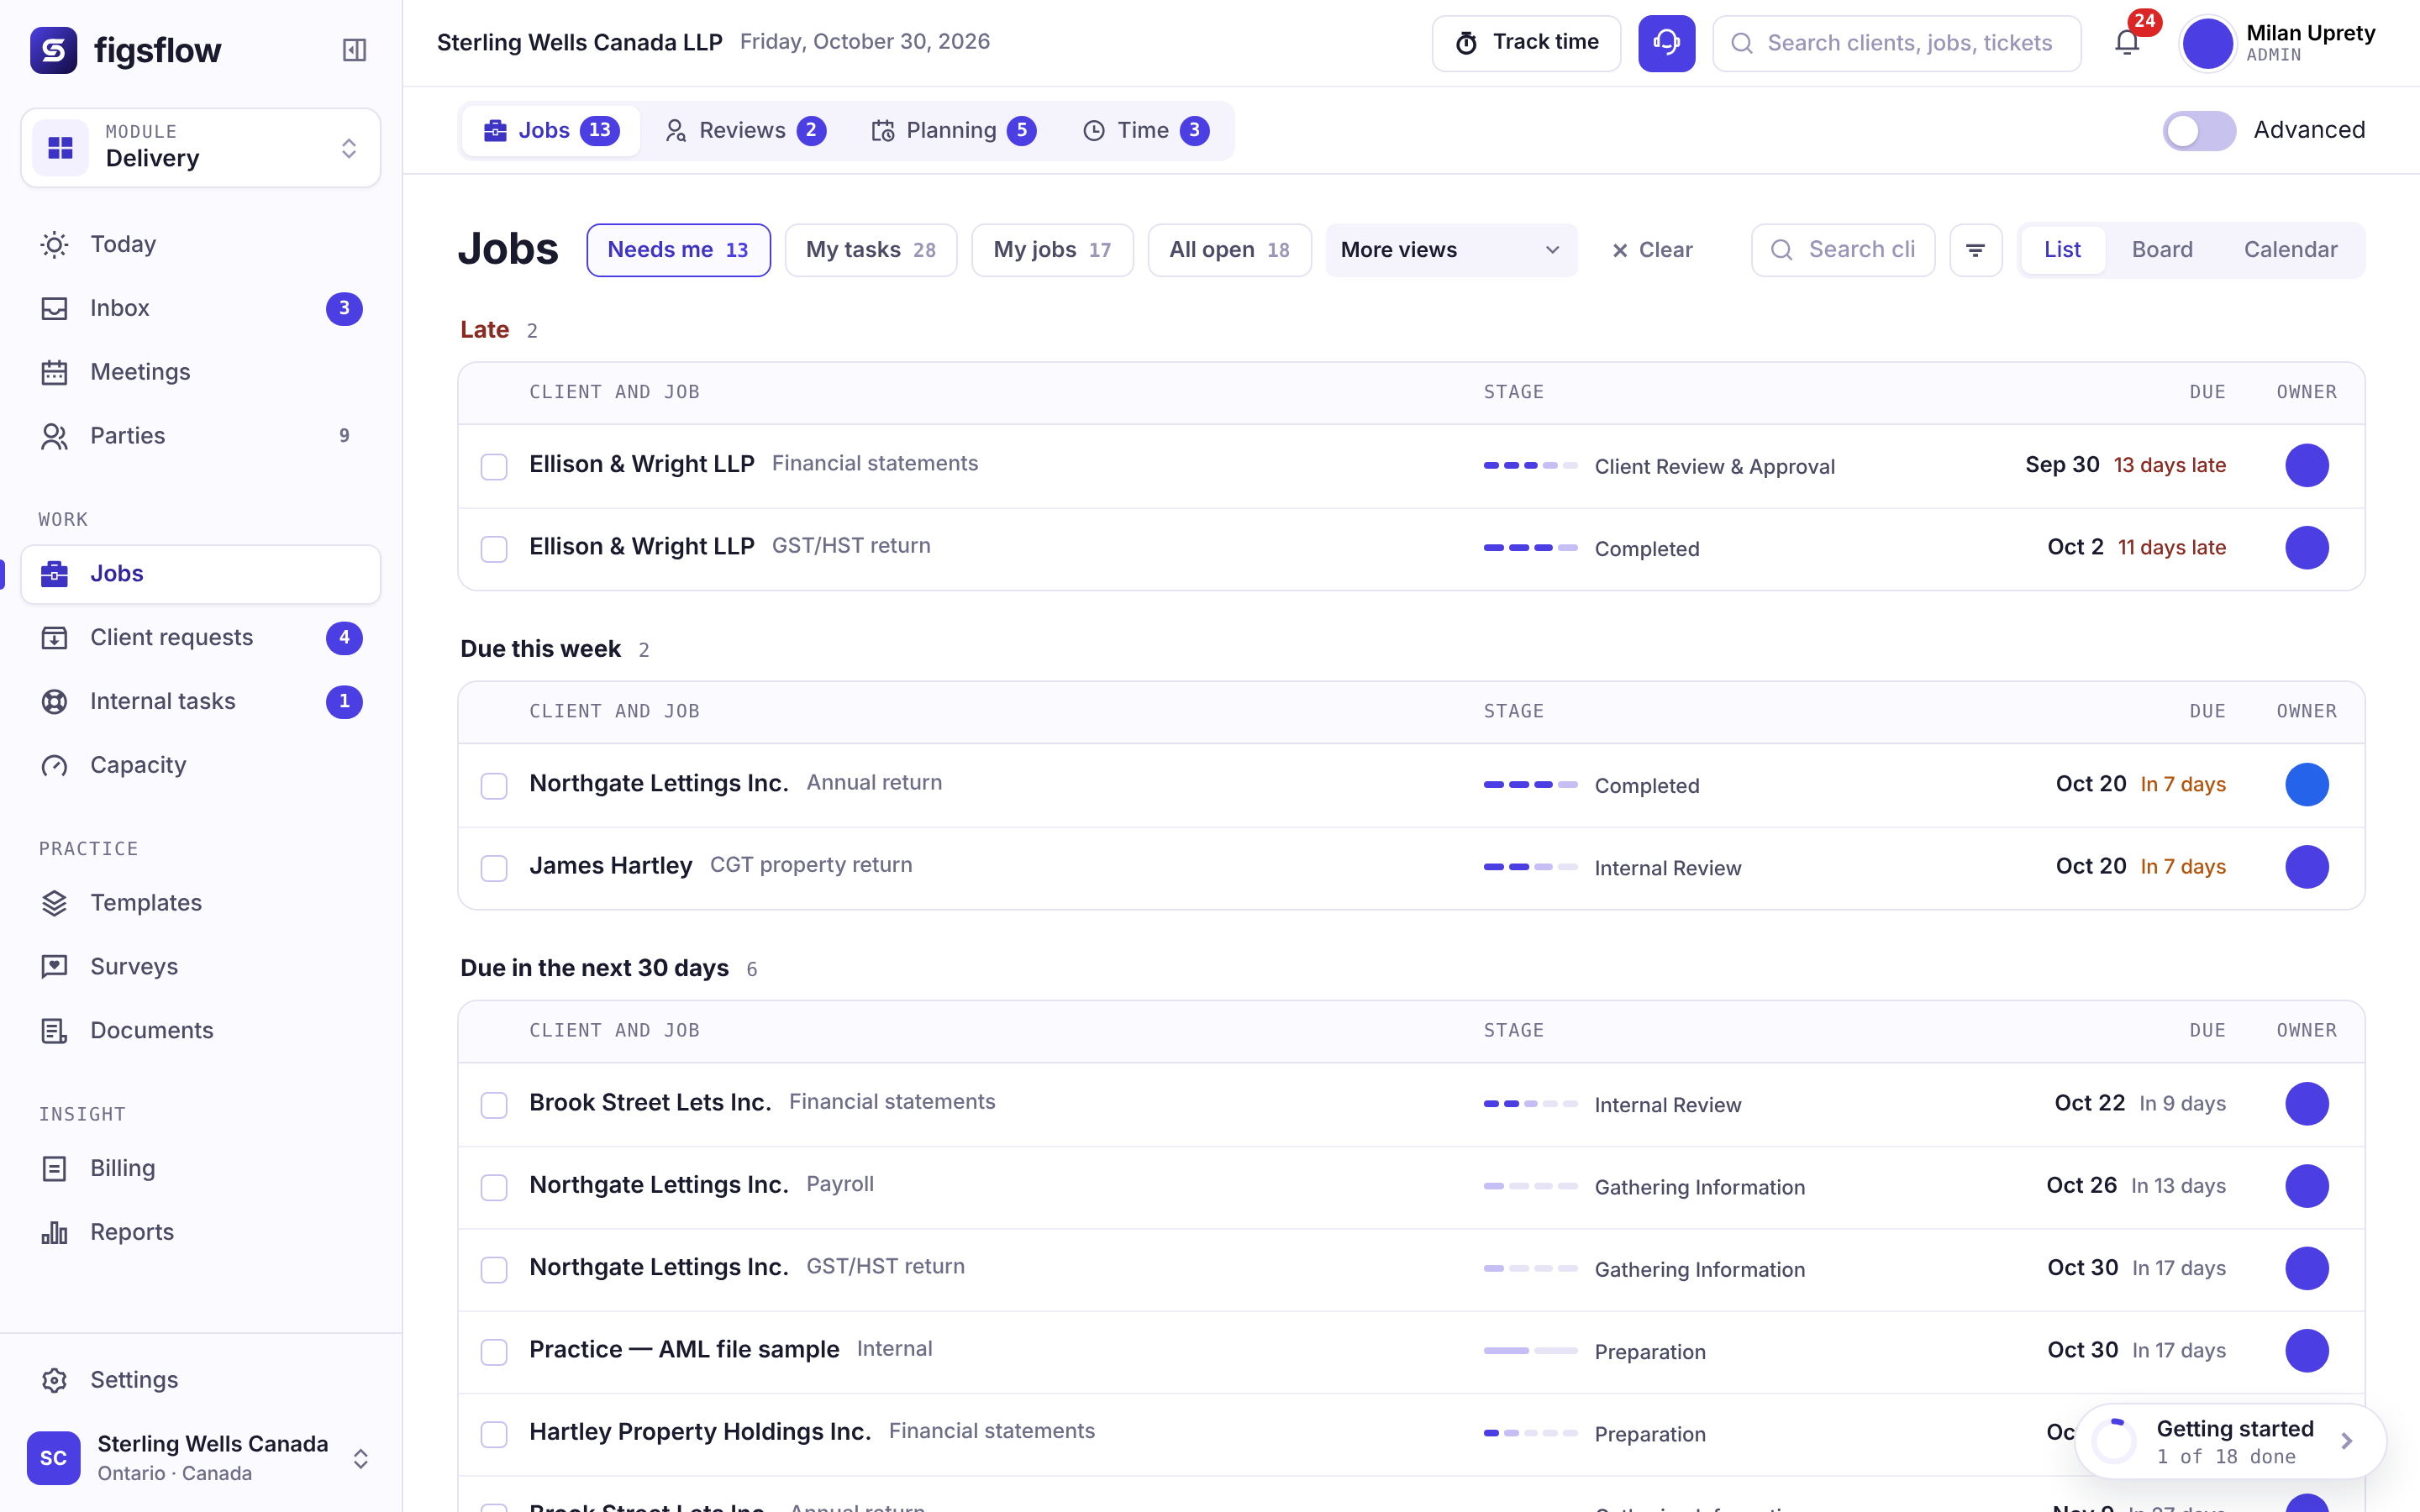
Statutory dates, with a firm target ahead
Filing dates for T1, T2 and GST/HST, payroll remittances and slip dates come from the CRA deadline calendar, each with the earlier internal target your firm sets.
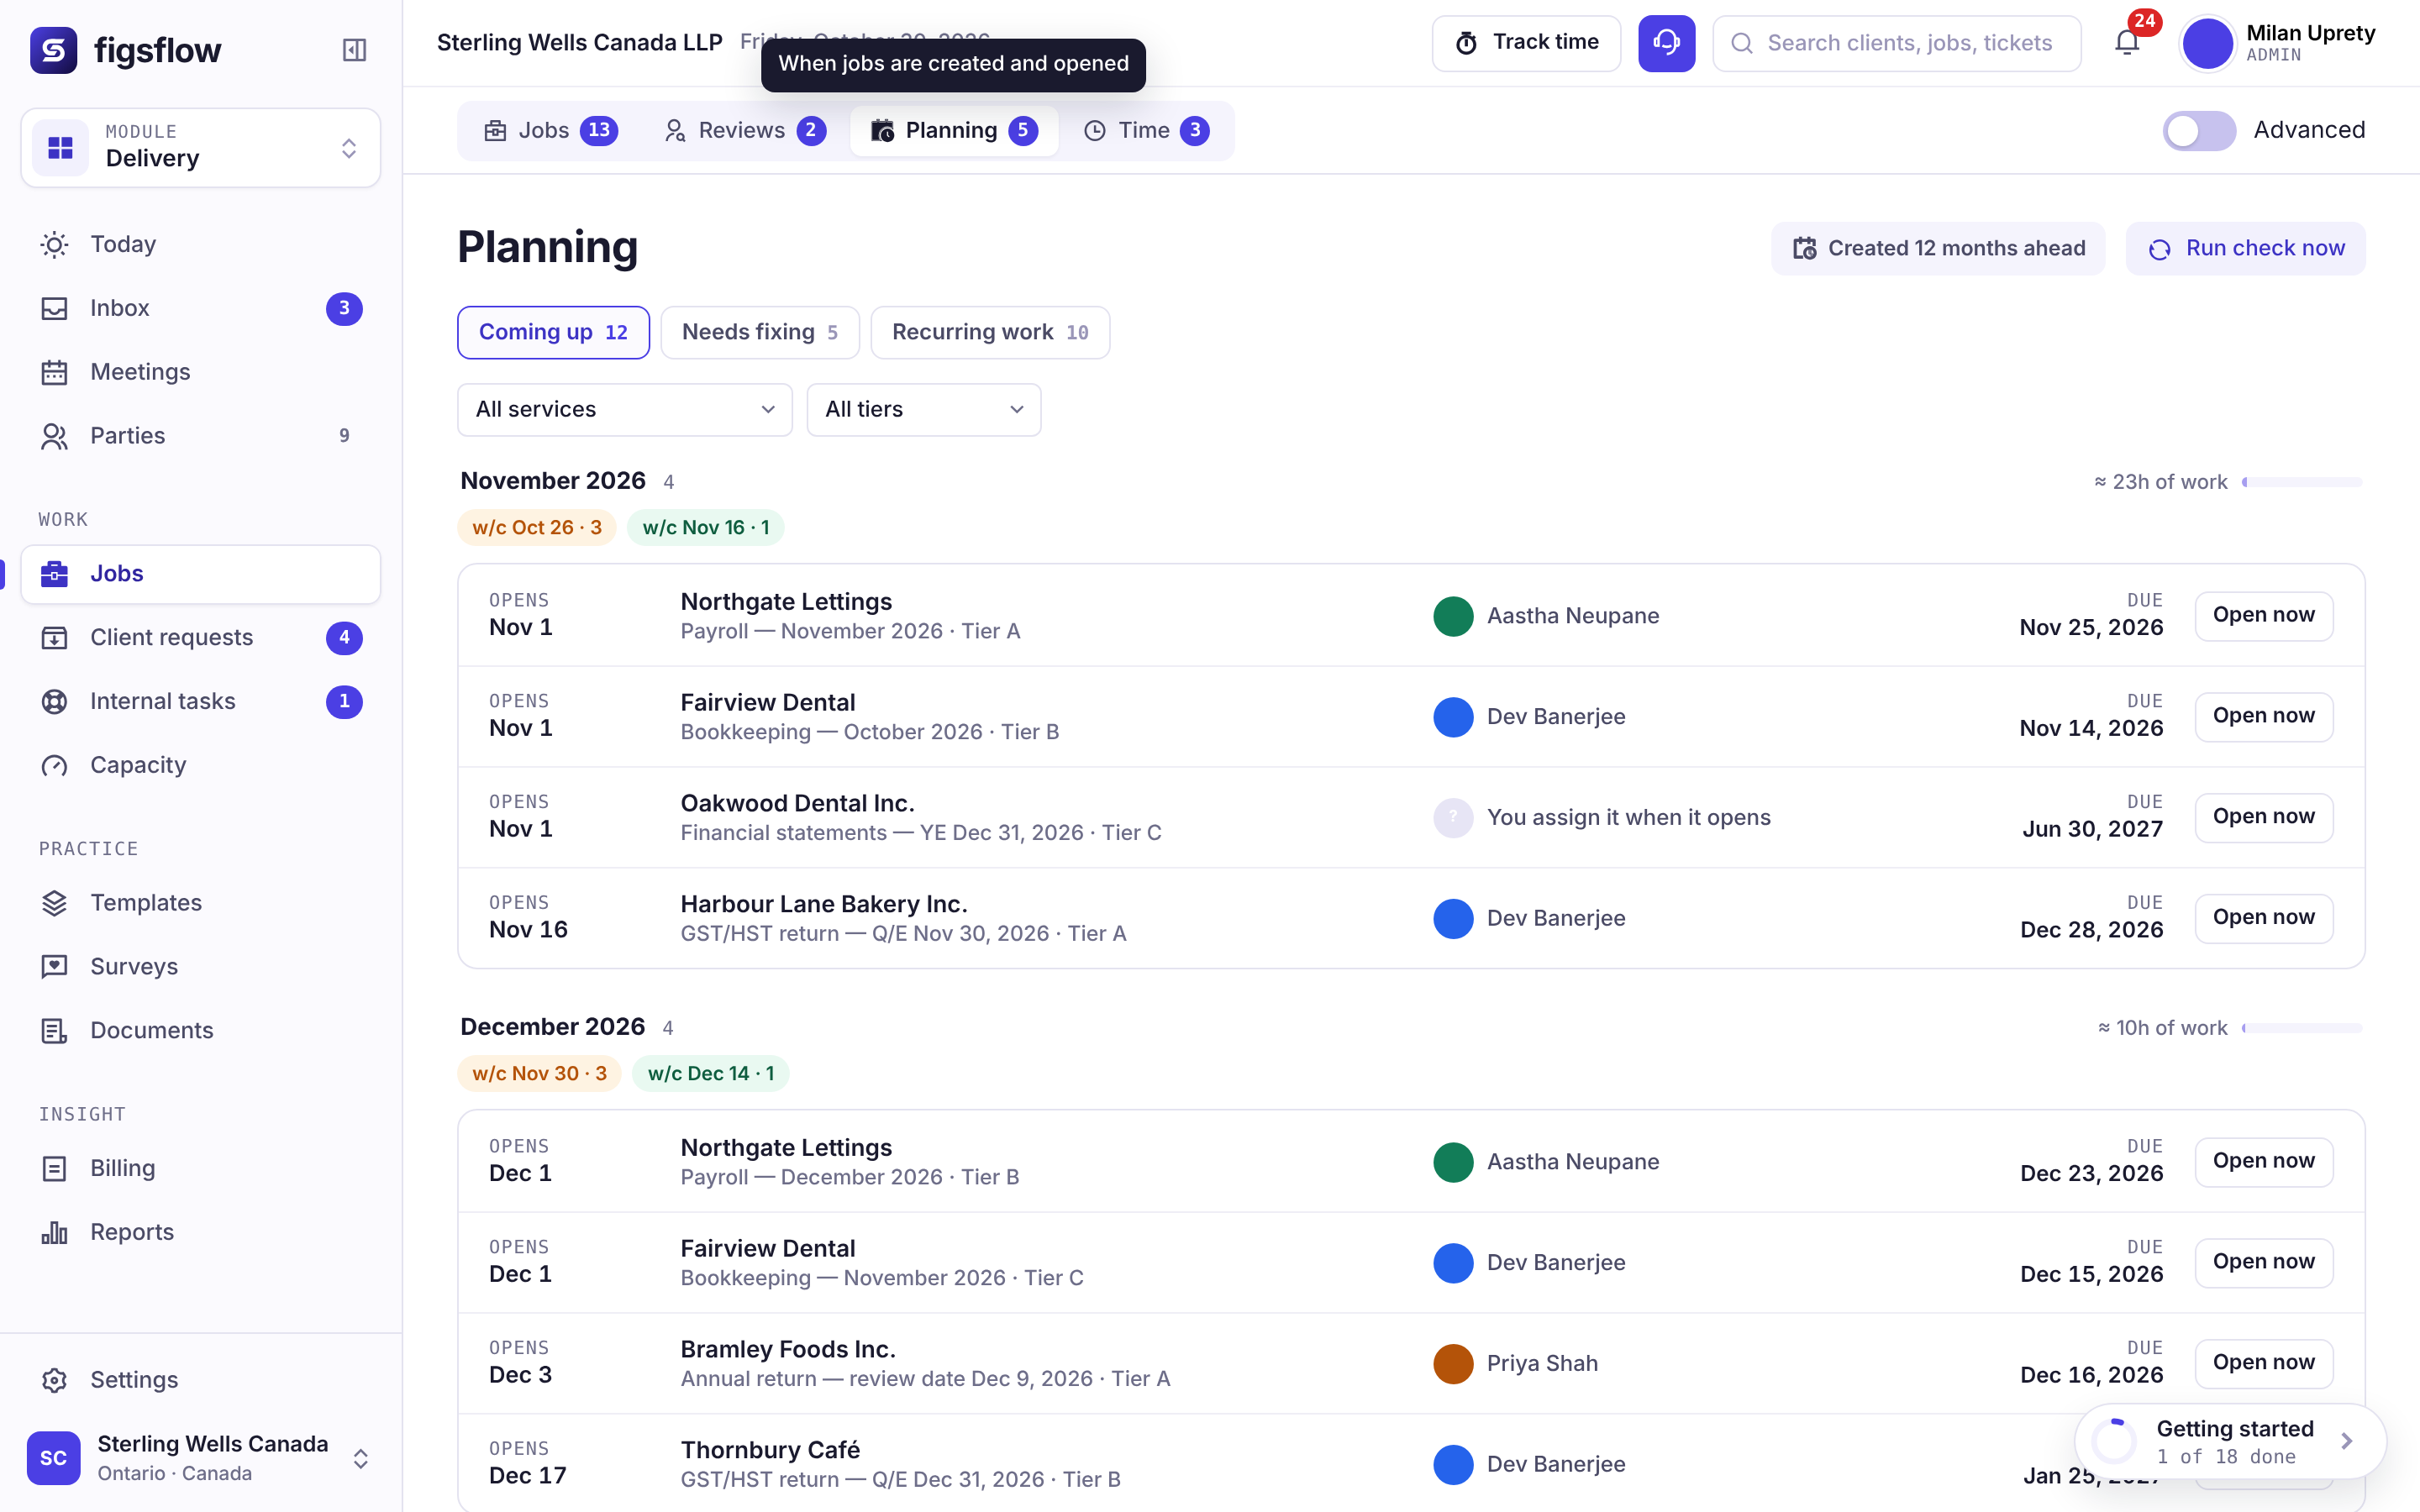
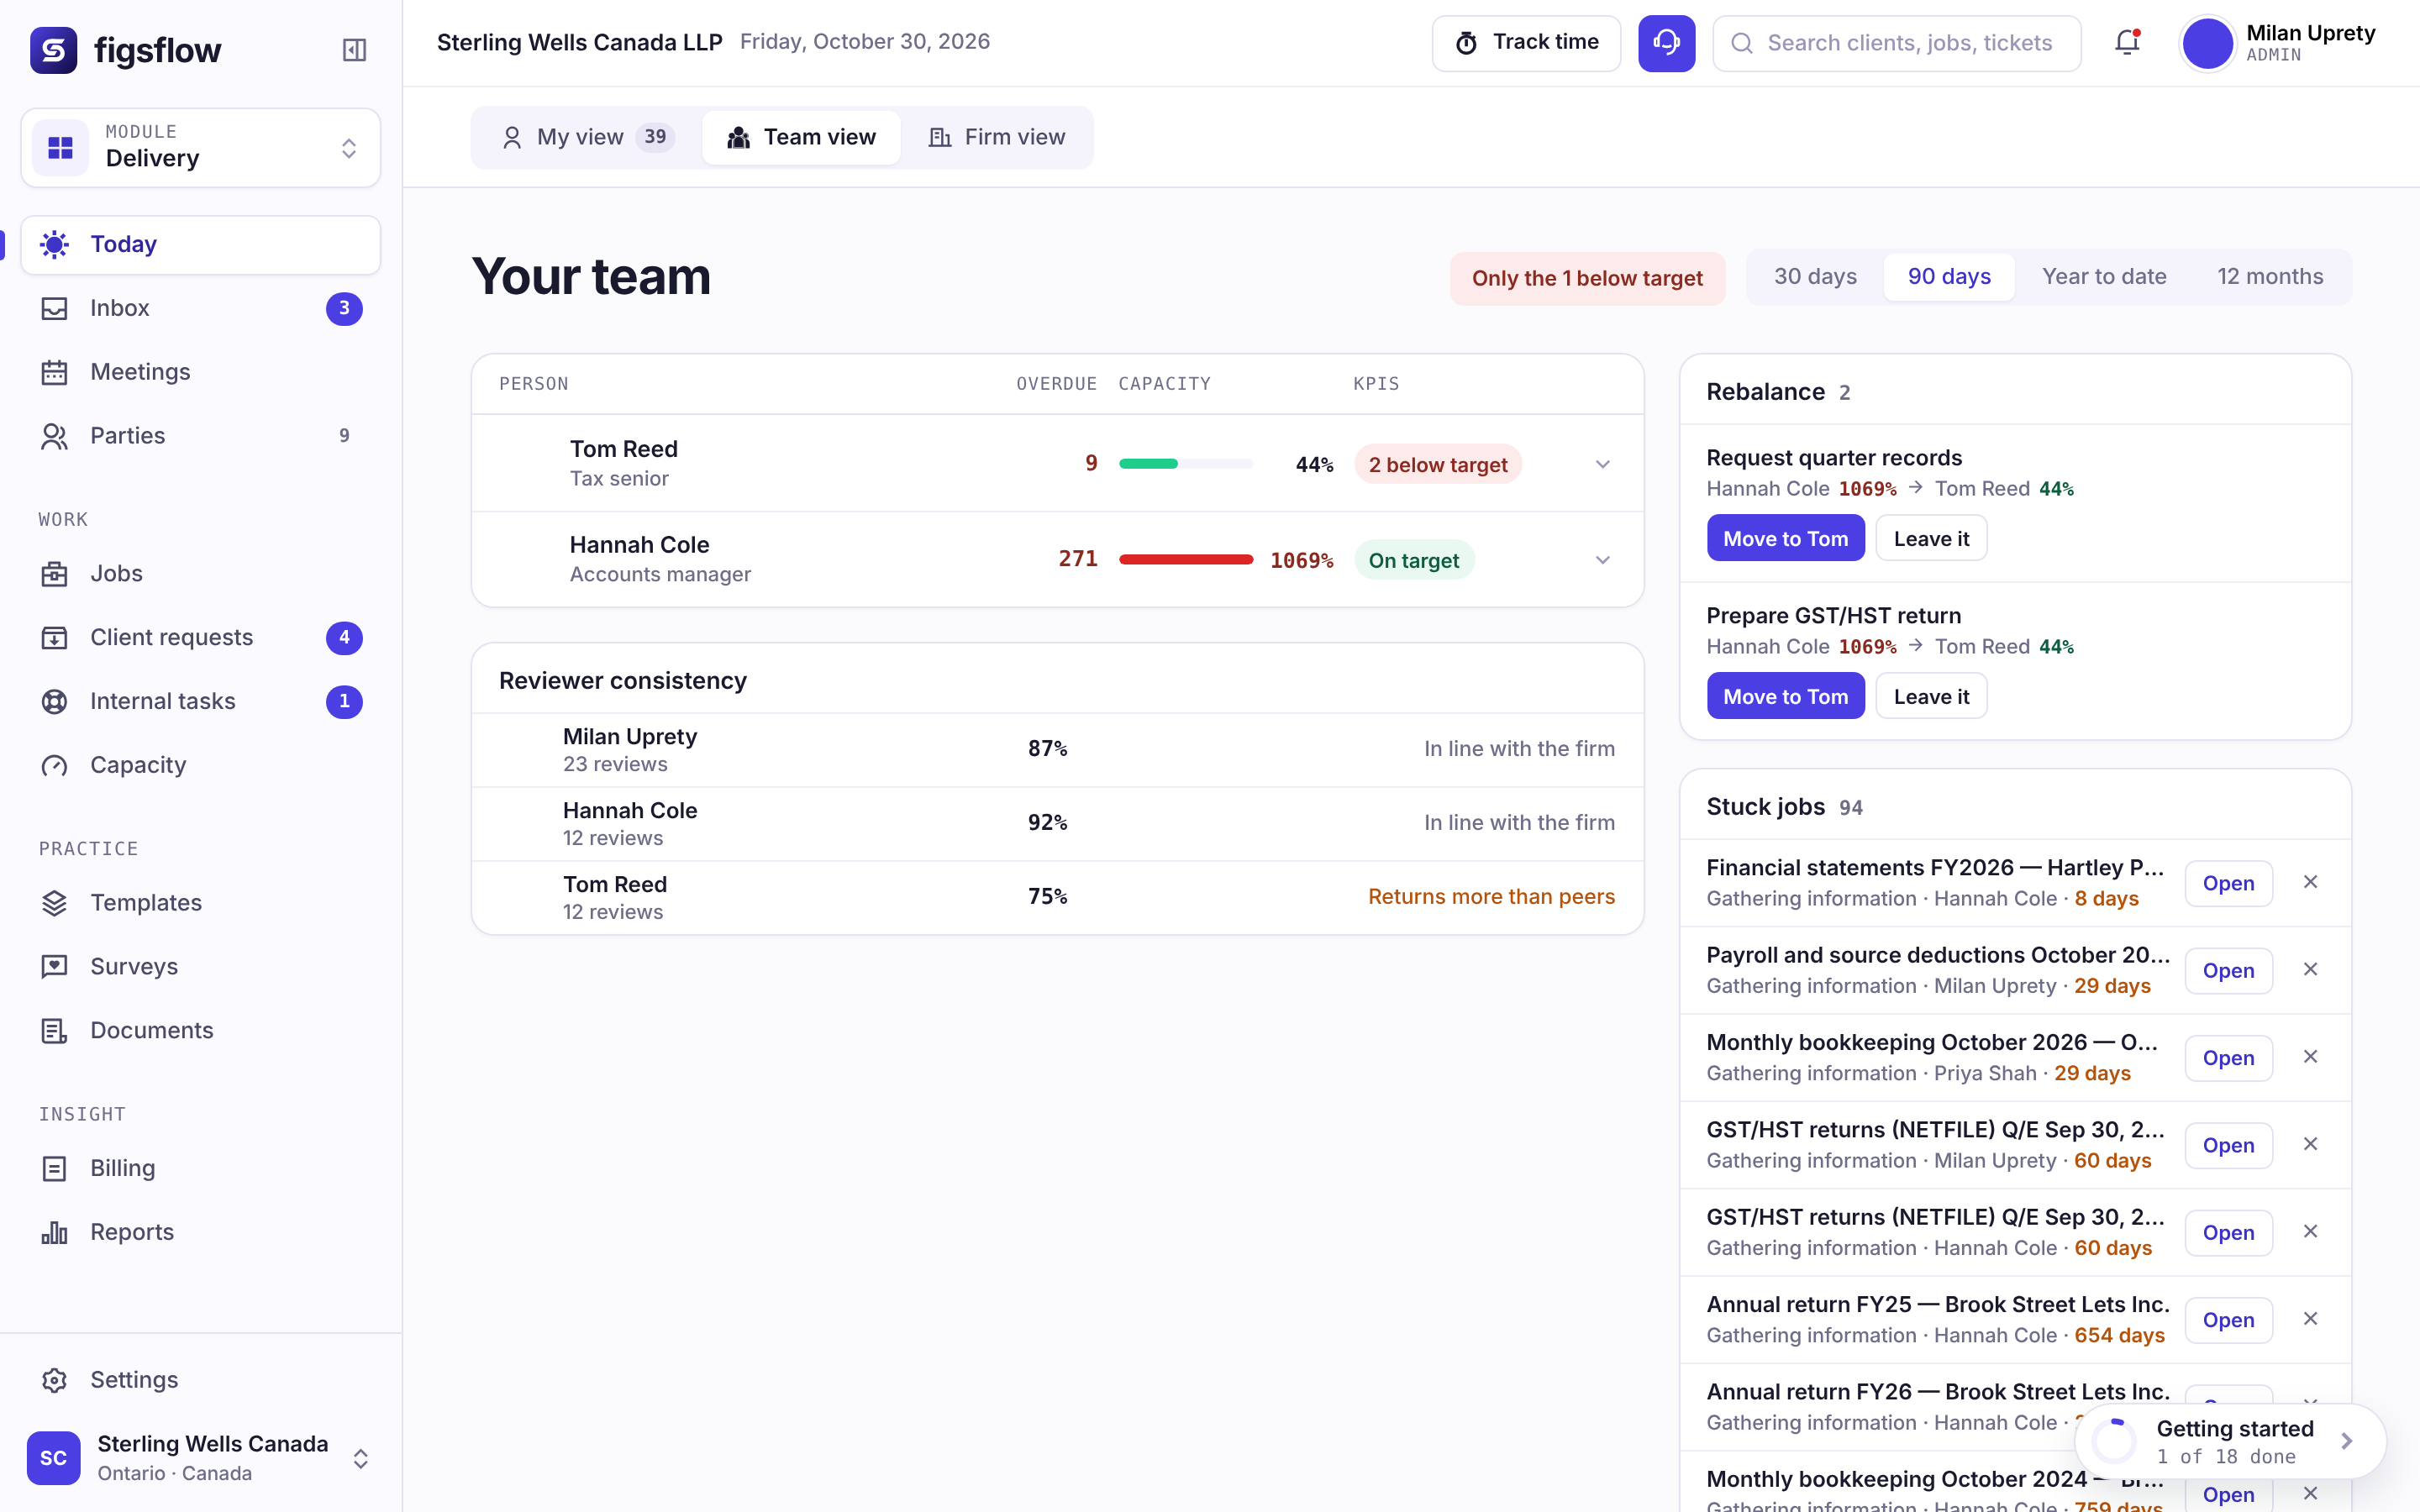
Capacity you can actually plan with
Booked hours against available hours for each person and team, so work moves before anyone reaches 120% in March.
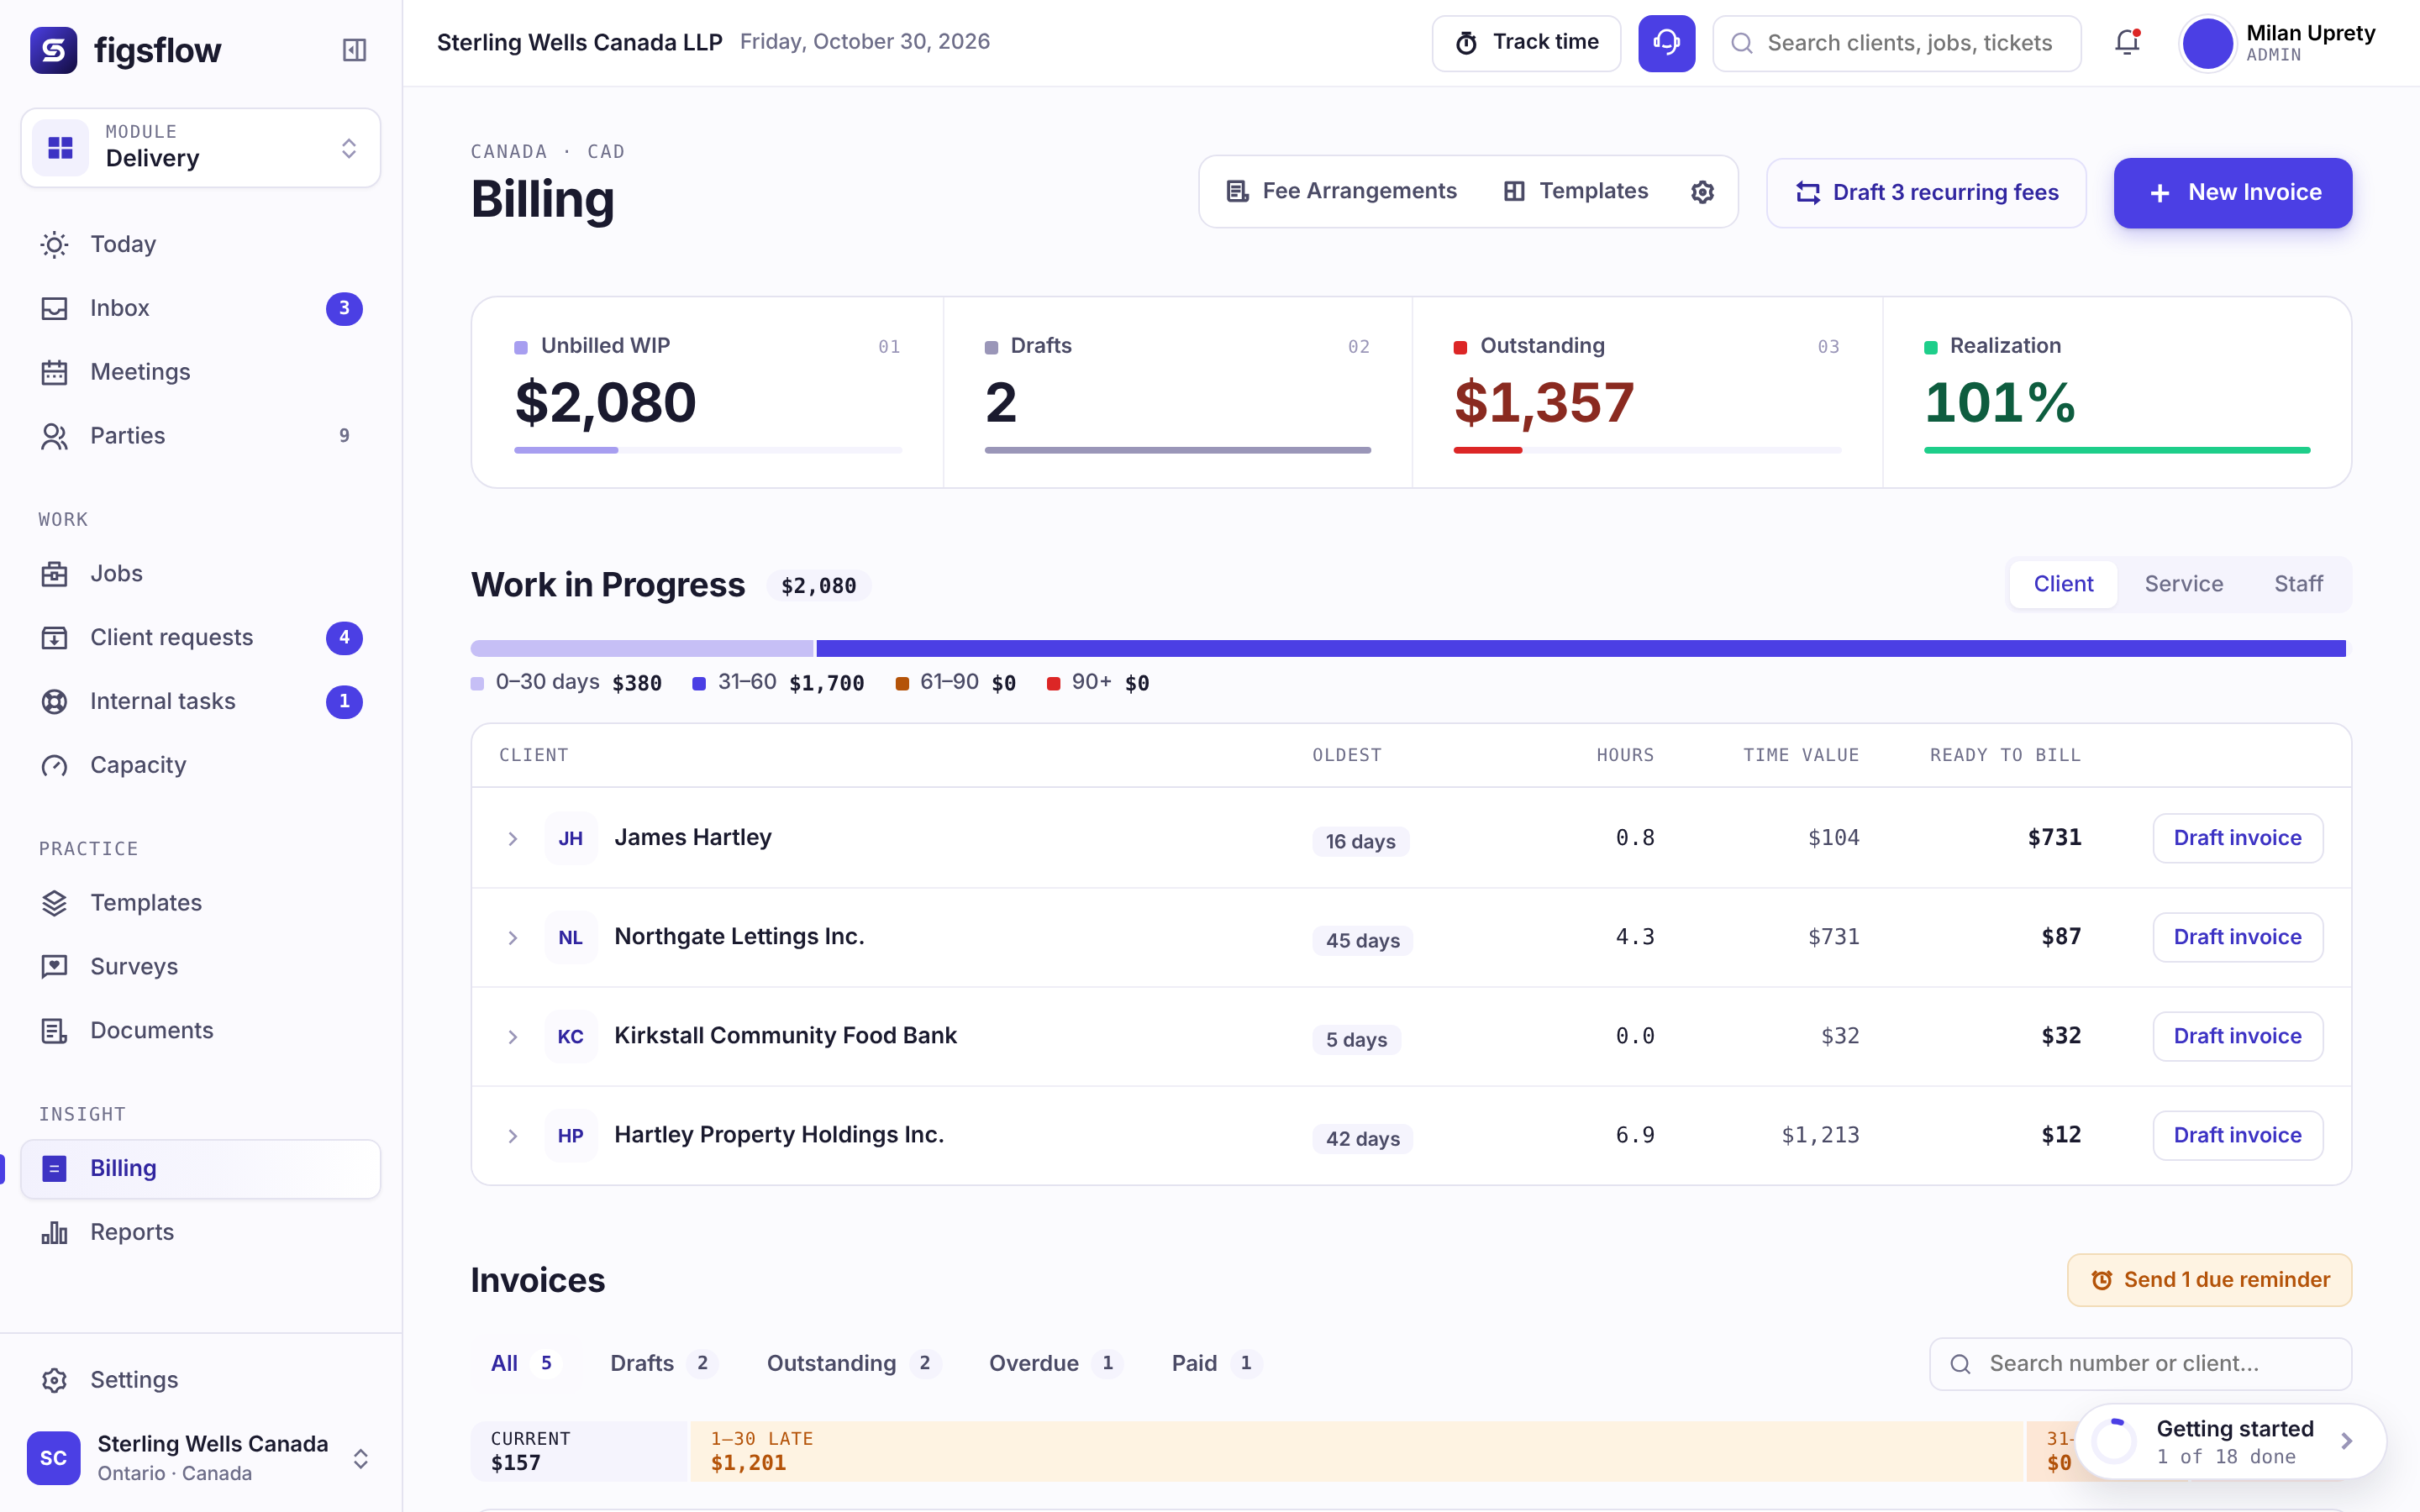
WIP, billing and lock-up in CAD
Unbilled time, invoices raised and debtor days in Canadian dollars, by partner and by client, straight from timesheets and billing.
A dashboard partners actually open
Live numbers, one click from the job behind them, shaped around how a Canadian practice runs its year.
Live KPI tiles
Jobs in progress, on-time rate, unbilled WIP and capacity, refreshed as the work moves.
Drill down to the job
Every number opens the jobs behind it, with owner, stage and the next step.
Partner and office views
Each partner sees their own book; the managing partner sees every office together.
Busy-season forecast
Expected T1 and T2 volume by week, from this year’s engagements and last year’s pattern.
Saved views
Save the filters you use every week and open them in one click.
Exports for meetings
Share the view with partners who would rather read a document than log in.
Measured against the Canadian tax year
A Canadian practice does not have one busy season; it has several. The dashboard is shaped around the dates that actually drive your workload.
February to April, planned in January
See expected personal tax volume by week, so you staff for the April 30 filing deadline instead of reacting to it.
T2 work spread across the year
Year ends vary by client, so T2 filing dates fall six months after each one. The dashboard balances that work across the calendar.
Monthly, quarterly and annual filers
Each client’s reporting period sets its own due dates, and the dashboard counts them by week.
Every province, one view
Filter by office or province, including Revenu Québec obligations for Quebec clients, without building a separate report.
Dates shown are illustrative. Confirm current CRA and Revenu Québec deadlines before relying on them.
In practice
Built from the work, not typed into a report
The dashboard has no data entry of its own. Jobs come from jobs, tasks and deadlines, dates from the CRA deadline calendar, hours from time and billing and capacity from team and capacity.
For deeper analysis, reporting and analytics takes the same numbers further. Response times on each client thread come from email, and every change behind a figure is recorded in the audit trail.
The modules behind every number
Each tile on the dashboard is fed by one of these. Open any of them to see where the figure comes from.